Quinn Perry · 26 October 2026
Seasonal Fluctuation Patterns in Organic Referral Traffic for Regional Service Directories
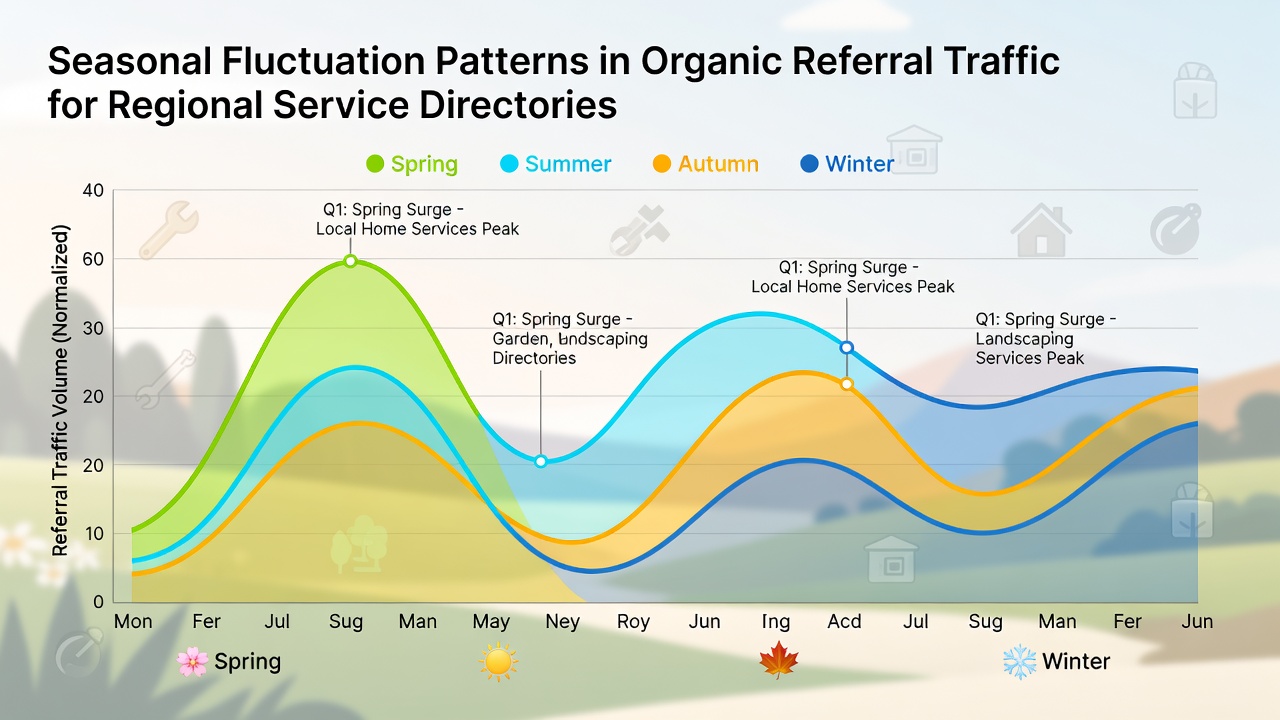
Regional service directories experience distinct cycles in organic referral traffic that align with calendar events, weather shifts, and consumer behavior changes throughout the year, and researchers tracking these directories have documented consistent rises and drops in visits during specific months. Data from multiple platforms shows that searches for home maintenance services spike in spring while queries for holiday-related services climb sharply before December, yet these patterns vary by region because local climates and cultural events influence user intent in different ways.
Core Drivers Behind Traffic Cycles
Weather conditions play a central role in directing users toward directories that list contractors, landscapers, and repair services, and studies tracking query volumes indicate that heavy rainfall or early snowfalls trigger immediate increases in searches for emergency plumbing and roofing providers. Economic reporting periods also coincide with these shifts since businesses update listings and users compare options ahead of major spending decisions, while government statistics from the US Bureau of Labor Statistics reveal that employment in construction and maintenance sectors follows similar seasonal rhythms that feed back into directory visibility.
Monthly Breakdown of Observed Patterns
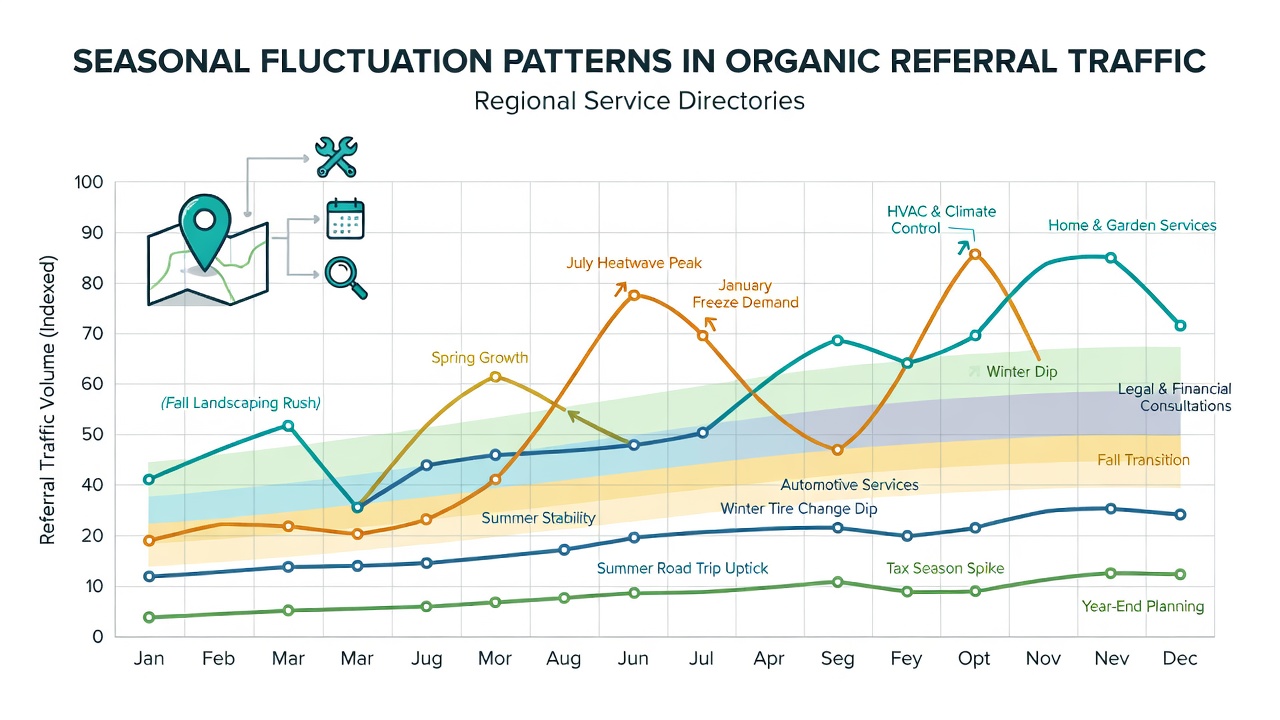
January typically brings elevated traffic for tax preparation and financial services as individuals seek local accountants and advisors, and February sees continued growth in those categories alongside spikes in automotive repair listings due to post-winter vehicle checks. March through May produce the strongest gains for outdoor and property care categories because homeowners begin planning landscaping, painting, and pool maintenance, yet June often marks a plateau or slight dip once initial projects wrap up and summer travel reduces local search activity.
July and August maintain steady but lower volumes in many regions because vacation periods shift attention away from routine services, while September triggers renewed interest in education-related directories and back-to-school support services. October 2026 data collected from several North American platforms showed particularly strong referral growth for heating system installers and insulation providers as temperatures dropped earlier than average, and similar trends appeared in European markets where energy cost concerns amplified queries during the same window.
Regional Variations and Comparative Data
Directories serving coastal areas display different peaks than those in inland or mountainous zones because storm seasons and tourism flows create unique demand signals, and analysts comparing US and Canadian datasets note that Atlantic provinces experience earlier spikes in winter preparation services compared with Pacific regions. Australian service directories, by contrast, show inverted patterns with summer peaks in December and January for cooling and outdoor equipment providers, while European Union reports highlight additional lifts during national holidays that vary by country.
One study from Statistics Canada examined 18 months of referral logs and found that directories in prairie provinces recorded 34 percent higher traffic for agricultural equipment services during harvest months than their counterparts in urban centers, and parallel findings from the Australian Bureau of Statistics confirmed that rural directories saw comparable spikes tied to seasonal farming cycles.
Measurement Approaches Used by Analysts
Teams monitoring these directories rely on multi-year datasets to separate recurring seasonal effects from one-time events such as algorithm changes or major news stories, and they cross-reference referral logs against public weather records and economic calendars to identify correlations. Custom dashboards allow segmentation by service category, geographic radius, and device type, which reveals that mobile referrals for emergency services rise more sharply during extreme weather events than desktop traffic does.
Longer observation windows help distinguish true seasonal signals from random noise, and experts note that directories covering broad service categories tend to show smoother curves while niche directories experience sharper but shorter peaks around specific events like local festivals or regulatory deadlines.
External Factors That Modify Expected Cycles
Global events and policy changes can shift or amplify normal seasonal patterns, and recent years have shown how supply chain disruptions altered the timing of home renovation traffic because material shortages delayed projects into later months. Public health measures in prior seasons also changed user behavior by increasing demand for contactless service options listed in directories, yet these modifications eventually realigned with traditional cycles once restrictions eased.
Researchers continue to track how emerging technologies such as voice search and localized advertising interact with seasonal demand, and preliminary figures from October 2026 suggest that directories integrated with real-time availability tools captured larger shares of referral traffic during peak periods compared with static listings.
Conclusion
Seasonal fluctuation patterns in organic referral traffic for regional service directories follow predictable rhythms driven by weather, cultural events, and economic cycles, and ongoing data collection across multiple regions continues to refine understanding of these movements. Observers who maintain consistent tracking methods can identify both recurring trends and emerging deviations, which supports more accurate planning for directory operators and listed service providers alike.